In semiconductor fabs, chemical plants, and many other continuous production environments, equipment downtime is never a small issue.
When a critical pump fails without warning, the cost is not limited to repair. It can interrupt production, affect yield, delay delivery, and create safety risks. Traditional maintenance usually relies on fixed schedules, manual inspections, or fault alarms. These methods are useful, but they often answer only one question:
Is the equipment abnormal right now?
For production teams, a more valuable question is:
How much longer can this equipment keep running safely?
That is the reason we started this pump remaining useful life prediction project.
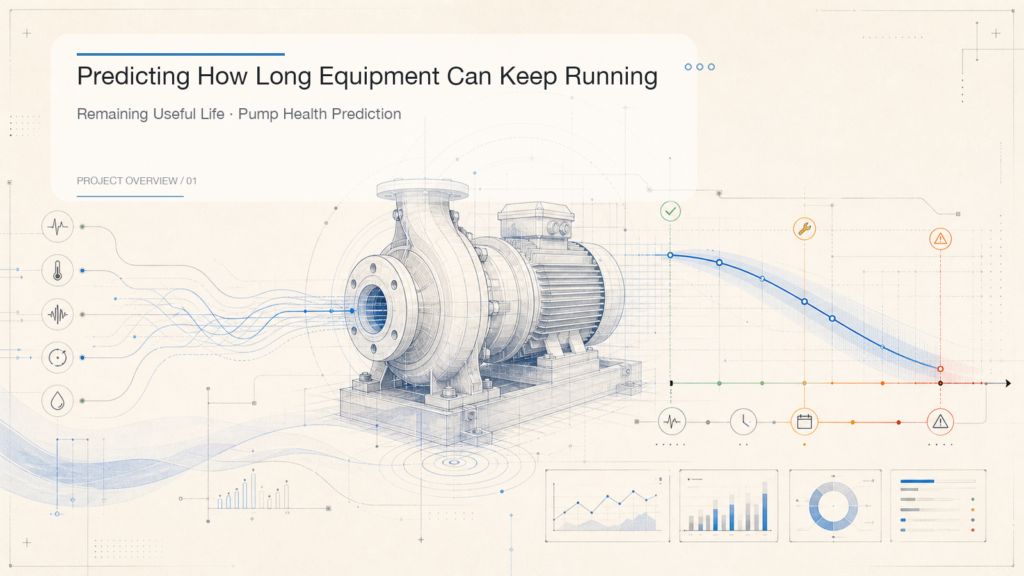
Project Goal: Predicting Remaining Useful Life
This project focuses on RUL, short for Remaining Useful Life.
Instead of simply judging whether a machine is normal or faulty, RUL prediction tries to estimate:
- How much time may remain before failure.
- Whether the equipment has entered a higher-risk stage.
- Whether maintenance should be scheduled earlier.
- Which changes may be early signs of degradation.
This is more useful than a simple alarm because an alarm often means the problem has already become obvious. Remaining life prediction aims to move the decision earlier, giving maintenance teams more time to plan, inspect, and act.
Vibration and Operating Signals as Early Health Clues
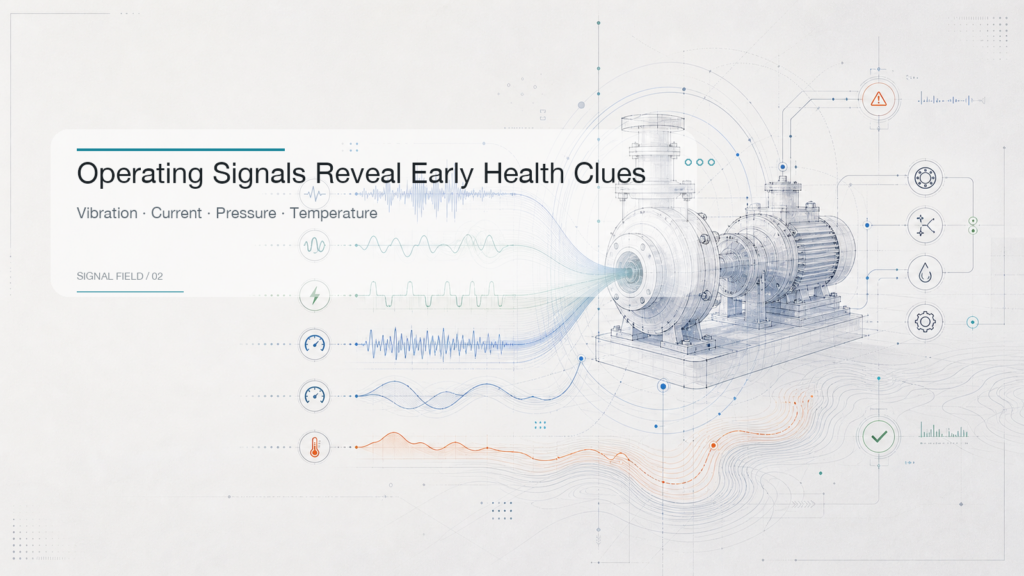
Mechanical equipment usually does not fail all at once. Before a visible fault appears, the machine often starts to change in small ways.
For example:
- Current may become less stable.
- Power consumption may slowly drift away from its normal range.
- Speed may fluctuate more than before.
- Exhaust pressure may show a gradual shift.
- Temperature and vibration patterns may begin to look unusual.
Each signal may look harmless on its own. But when these signals are observed over time, they can reveal that the equipment condition is changing.
Pumps are especially suitable for this kind of analysis because they continuously produce operating signals. These signals are like the vital signs of the machine. The goal is to read those signs and understand how equipment health is changing.
From Fault Alarms to Early Prediction
Traditional monitoring systems often use threshold alarms. When a value crosses a preset limit, the system sends an alert.
This is simple and direct, but it has limits:
| Traditional Alarm | Remaining Life Prediction |
|---|---|
| Checks whether a value has crossed a limit | Checks whether a trend is getting worse |
| Often reacts after the problem is obvious | Tries to identify risk before failure |
| Outputs normal or abnormal | Estimates how long the equipment may keep running |
| Best for real-time monitoring | Best for maintenance planning and risk control |
Remaining life prediction is not meant to replace alarms. It makes the monitoring system more useful by changing the question from “Has it failed?” to “When might it fail?”
A Workflow from Equipment Data to Life Prediction
In simple terms, we built a workflow that turns equipment operating data into a remaining life estimate.
The workflow does several things:
- Collects continuous data from the pump during operation.
- Cleans incomplete or inconsistent data so the information is more reliable.
- Splits long operating records into shorter observation windows.
- Extracts health indicators from each window.
- Lets the prediction model learn the patterns that appear before failure.
- Estimates how much time may remain before the equipment reaches failure.
You can think of it as a health trend assessment for industrial equipment.
It does not look at only one moment. It looks at how the equipment state changes over time, because real degradation is usually gradual rather than sudden.
Continuous Time Windows Reveal Real Degradation
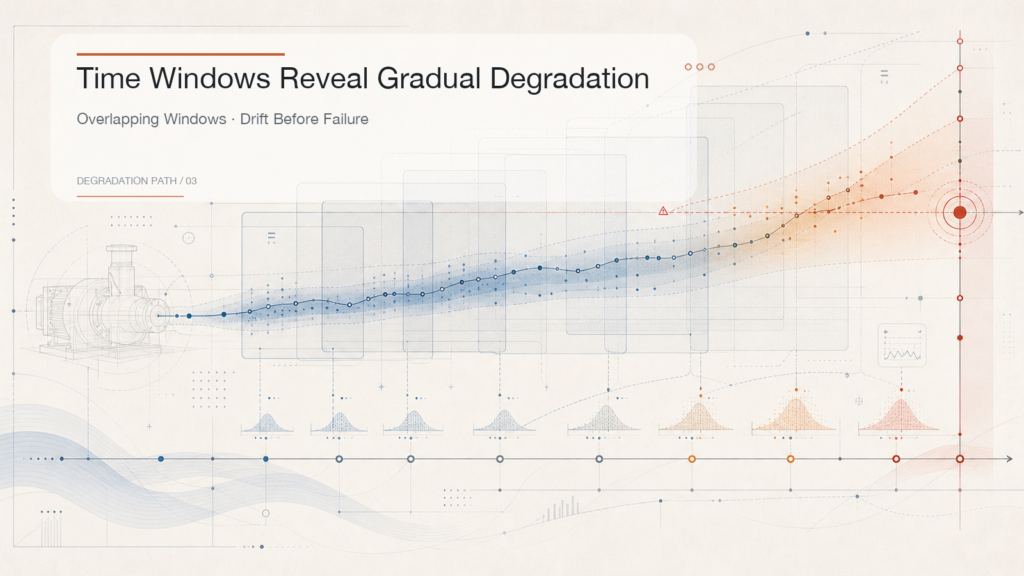
Equipment failure usually does not jump from 0 to 1 in a single instant.
More often, small fluctuations appear first. Then the fluctuation range becomes wider. The trend slowly moves away from normal behavior. Only later does the problem become obvious.
If we look at only a single data point, these changes are easy to miss. But if we observe 10 minutes, 30 minutes, or several hours of operation, we can see much more:
- Whether signals are becoming less stable.
- Whether vibration or pressure is rising over time.
- Whether abnormal cycles are appearing in operation.
- Whether several signals are getting worse at the same stage.
This is the value of window-based analysis. It allows the system to see not just a moment, but a process.
Model Convergence from Real Data
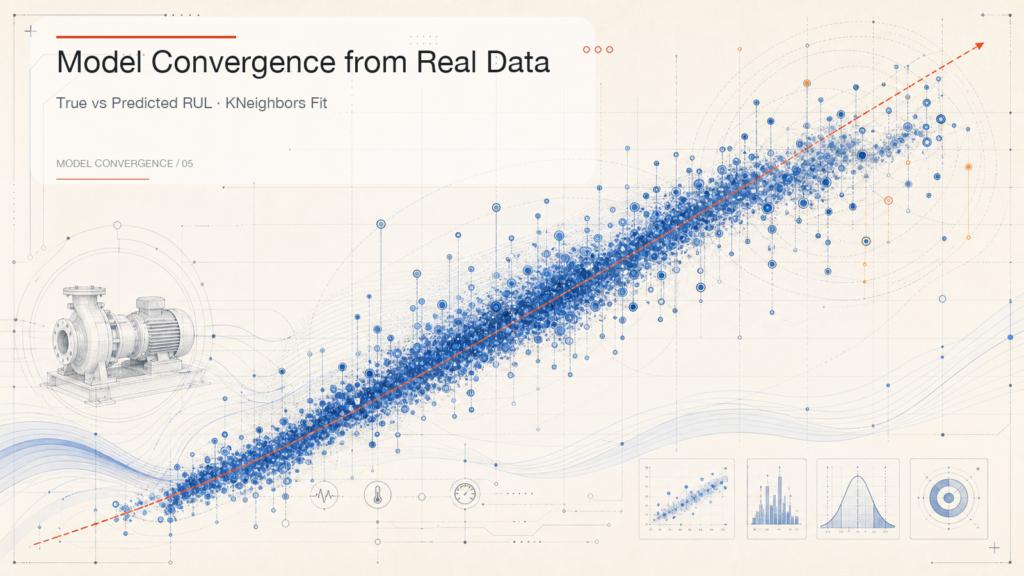
The real data chart gives a useful way to understand prediction quality.
The diagonal reference line represents the ideal case: the predicted remaining life is exactly the same as the true remaining life. The closer the prediction points are to this line, the more consistent the model is with the real equipment record.
In this result, many prediction points follow the diagonal trend, which means the model has learned a meaningful relationship between operating signals and remaining life. At the same time, the spread becomes wider in some high remaining-life areas. This is also important: it reminds us that prediction is not a perfect answer, but a decision support signal with uncertainty.
For industrial maintenance, this kind of output is already valuable. It can help teams notice risk earlier, compare equipment health trends, and decide where to focus inspection effort.
Key Lessons from the Project
One important lesson from this project is that prediction quality does not depend only on how complex the model is. It depends even more on whether the data has been understood correctly.
1. Data quality matters more than flashy models
In real industrial data, missing values, noise, and inconsistent formats are common.
If these issues are not handled well, even a very complex model can learn the wrong pattern. By contrast, clean data, continuous signals, and removal of irrelevant information often lead to more stable results.
2. Equipment degradation is a process
A pump does not necessarily fail because of one isolated spike.
The valuable information is usually in the trend: whether values are gradually increasing, whether fluctuations are becoming stronger, and whether multiple signals point to the same degradation pattern.
That is why we focus more on the overall changes inside time windows than on isolated data points.
3. Mature methods still have real value
When people talk about AI, they often think of the newest and most complex methods.
In this project, we found that carefully prepared data combined with reliable, mature prediction methods can still produce strong results. For industrial use, the best model is not always the most complex one. Stability, explainability, and ease of deployment are often just as important.
4. Iteration speed determines long-term progress
Industrial data can be large, and analysis often requires repeated comparison.
If every adjustment requires all data to be processed from the beginning, the project becomes inefficient. Reusing intermediate results allows the team to compare ideas faster and spend more time on meaningful judgment.
The Practical Value of Predictive Maintenance
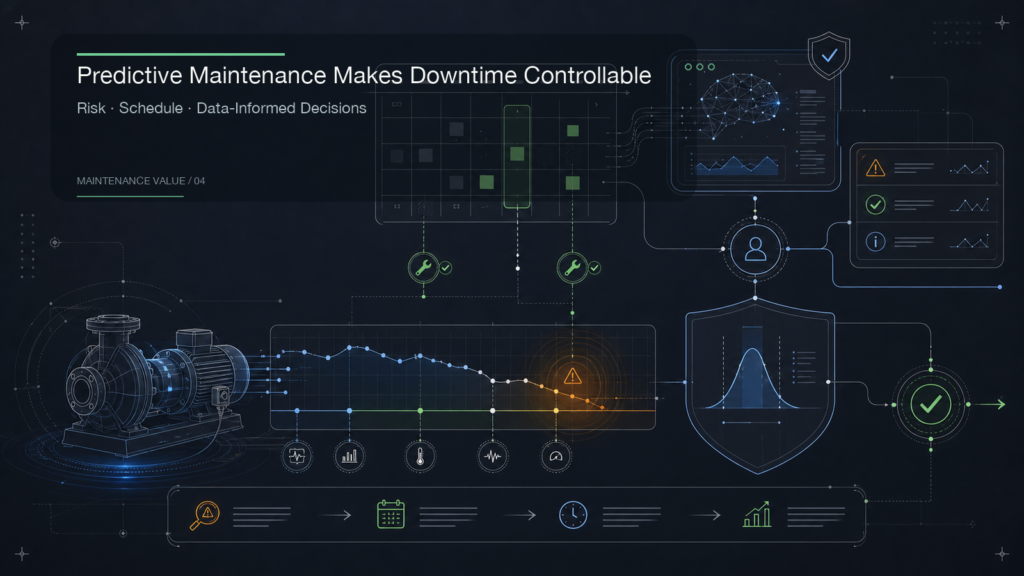
For factories and maintenance teams, remaining life prediction brings value in several practical ways.
Earlier risk discovery
Before equipment truly fails, the system can use historical trends to identify possible risk and help teams pay attention earlier.
Better maintenance planning
Maintenance no longer has to rely only on fixed schedules, and teams do not have to wait for alarms before taking action. Risk level can help determine a better maintenance window.
Less unplanned downtime
If the system can identify that equipment is entering a higher-risk stage, teams may be able to act during a planned production window and reduce the chance of sudden stoppage.
More data-informed decisions
Maintenance decisions no longer depend only on experience. Engineers can combine equipment data, prediction results, and on-site knowledge.
Better equipment health records
As data accumulates, each machine can build a more complete health history. This helps teams improve maintenance strategies over time.
Health Prediction Scenarios for Continuously Running Equipment
This type of method is suitable for equipment that runs continuously, has high downtime cost, and produces stable sensor data, such as:
- Vacuum pumps, dry pumps, booster pumps, and other pump systems.
- Key rotating parts in semiconductor manufacturing equipment.
- Continuously operating equipment in chemical production lines.
- Fans, compressors, motors, and similar mechanical systems.
- Industrial sites that need predictive maintenance.
These scenarios share one common feature: the equipment continuously produces operating signals, and visible failure is often preceded by observable degradation.
The Boundaries of Remaining Life Prediction
Remaining life prediction is valuable, but it is not magic.
It cannot guarantee that every failure will be predicted perfectly. It also cannot replace the judgment of experienced on-site engineers. Prediction results should be treated as an important reference for maintenance decisions, not the only basis.
In real use, the result should be considered together with:
- Equipment type.
- Changes in operating conditions.
- Maintenance history.
- On-site inspection.
- Production schedule.
- Safety rules.
The model can help people see risk earlier, but final decisions still need professional judgment based on the real operating context.
Next Step: More Data and Field Integration
The next step is to bring in more data sources so the system can learn from more machines, more operating conditions, and more failure patterns.
At the same time, the prediction capability should become easier to connect with field systems. Ideally, it can read the latest sensor data, estimate the current health trend and remaining life, and show the result on a maintenance dashboard.
The final goal is not to build a model that stays in the lab. The goal is to build a predictive maintenance capability that operations teams can actually use.
Final Thoughts
Pumps do not wait until we are ready before they fail.
A useful system should help people see changes, understand risk, and gain more time before failure happens.
That is the meaning of this RUL project: equipment data should not only record the past. It should also help us judge the future.
When a machine can tell us earlier how much longer it may keep running, maintenance can move from passive response to proactive planning.